Mastering Sell Through Rate: Formula and Calculation Revealed!
By Sonaksh Singh Rawat on

A sell-through rate is a good indicator of how businesses manage their inventory. Despite employing various inventory costing methods to enhance sales and track the merchandise sold, the efficiency of their inventory’s movement is frequently ignored. This includes a lack of attention towards their average sell-through rate and disregarding the calculation of sell-through.
A high sell-through rate indicates that an establishment is ordering inventory in accurate quantities to meet demand and efficiently manage its movement.
Conversely, a low sell-through rate suggests either an excess in inventory orders or a lack of customer interest in purchasing the stock at the proposed prices. This scenario points to a fundamental issue with the establishment’s inventory forecasting, demand planning, differences between procurement, purchasing, and sourcing, or its pricing strategy.
The article will talk about sell-through rates and their significance. Understanding the sell-through formula is crucial for mastery in cross-selling and more. From calculating sell-through to strategies for improving the sell-through rate, all the necessary knowledge to embark on this journey will be covered.
What Is A Sell Through Rate?
The sell through rate (STR) is a key performance indicator (KPI) that measures the percentage of inventory sold in a given period. It serves as an important metric for companies to understand if they are overstocking or understocking their products in relation to customer demand.
Key Takeaway: A company’s sell-through rate points out the proportion of inventory sold during a specific timeframe, helping to ascertain if the inventory levels are adequate.
What Does Sell Through Mean for Your Business?
Businesses employ sell-through rates to determine the speed at which their finished goods inventory or merchandise inventory sells, essentially measuring how swiftly an investment in inventory translates into revenue.
The advantage of the sell-through rate is its ability to not only gauge total inventory but also to pinpoint how inventory from specific manufacturers or product lines performs. This allows businesses to identify which products from which suppliers represent the best investment.
A low sell-through rate may indicate the potential to optimize inventory carrying costs and pricing strategies. If the pipeline inventory is functioning smoothly, the sell-through rate will reflect this efficiency. Similar to inventory turnover, it serves as a metric to assess the efficiency of a business’s supply chain.
How to Calculate Sell Through Rate
Sell-through rates are calculated by companies to gauge their inventory’s performance by dividing the number of units sold by the number of units received, and multiplying the result by 100 to yield a percentage.
This indicator is crucial for predicting future demand and enables companies to understand the pace at which their inventory is sold. Sell-through rates also play a significant role in determining the fill rate. A high sell-through rate suggests that products are moving fast and might require quick replenishment, whereas a low rate indicates slower sales, potentially leading to excess inventory.
For an accurate assessment of the sell-through rate (STR), it is important to monitor both units sold and units received over a period. This practice aids in identifying sales trends and refining demand forecasting.
Moreover, when computing sell-through rates, returns and cancellations must be taken into account. Products that are returned or canceled need to be excluded from the units sold tally to ensure the sell-through rate accurately reflects the velocity at which products are sold, thereby assisting in managing stock levels more efficiently.
What Is the Sell Through Formula?
To understand the sell-through calculation, it’s helpful to look at its formula:
STR = (Number of Units Sold / Number of Units Received) x 100
This method is applied to grasp the concept of sell-through rate effectively.
Sell Through Calculation
BlueCart Coffee Distribution Company, a fictional entity in the realm of coffee roasting, embarks on a significant venture at the start of the year by acquiring 300 pounds of green, unroasted coffee beans on January 1st. Over the course of January, the company meticulously processes all these beans, roasting and packaging them, ultimately selling 180 pounds. By the end of January, specifically on the 31st, they find themselves with a remaining stock of 120 pounds of roasted, packed coffee ready for sale.
STR = (180 / 300) x 100
STR = .6 x 100
STR = 60%
Why Measure Sell Through Rate?
For eCommerce retailers, the sell through rate is one of the essential eCommerce KPIs. This metric is critical as it indicates the speed at which inventory is sold, playing a significant role in assessing overall profitability. There are three key reasons why monitoring sell through rate is beneficial:
- It reveals potential inventory level issues. A low sell through rate, as shown by abc inventory analysis, may signal an excess of inventory. This situation can lead to reduced prices and other challenges that negatively impact profits.
- It aids in optimizing stock levels. Understanding how quickly inventory moves enables adjustments in ordering to maintain optimal stock levels. This practice helps prevent the financial burden of overstocking, which can diminish profits.
- It provides insights into customer behavior. Rapid sales of certain items indicate the need to adapt the wholesale marketing plan and pricing strategies to enhance profitability. On the other hand, slow-moving items warrant further investigation to identify and address sales barriers.
In summary, monitoring sell through rates is crucial for effective inventory management. By comprehending this metric, decisions regarding inventory levels, stocking strategies, and pricing can be better informed, leading to increased profits.
What Is a Good Sell Through Rate?
The ideal sell through rate often differs across industries and organizations, yet a general consensus suggests that achieving over 80% is highly favorable. This indicates that out of every 100 high-demand products available, at least 80 should be sold to consider the rate successful. A lower sell through rate than this benchmark might suggest the necessity for adjustments in pricing or promotional strategies. Various factors can influence sell through rates, making it crucial to monitor this metric closely and implement necessary modifications accordingly.
Average Sell Through Rate

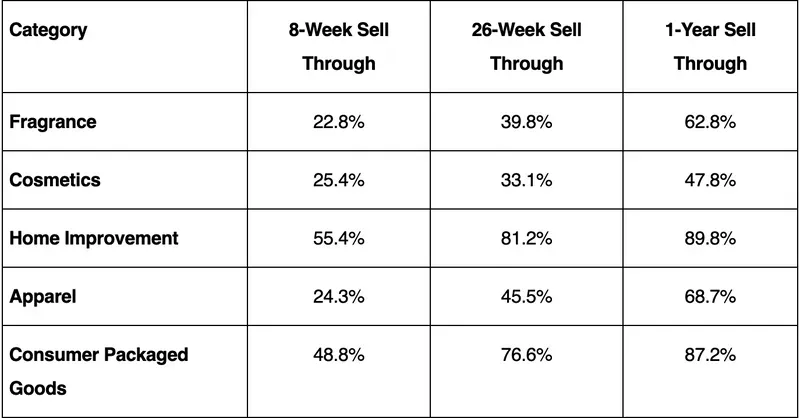
The average sell-through rate typically ranges between 40% and 80%. A chart from Accelerated Analytics, a firm specializing in retail POS data reporting and analysis, illustrates varying sell-through rates across different categories:
Category
8-Week Sell Through
26-Week Sell Through
1-Year Sell Through
Fragrance
22.8%
39.8%
62.8%
Cosmetics
25.4%
33.1%
47.8%
Home Improvement
55.4%
81.2%
89.8%
Apparel
24.3%
45.5%
68.7%
Consumer Packaged Goods
48.8%
76.6%
87.2%
This data reveals that the sell-through rate tends to increase over time, which means what is considered a “good” sell-through rate can vary.
Certain products, particularly those with a lower inventory days supply (DSI), require quick sales. These items have limited time available to remain unsold, which may negatively impact their sell-through rates. However, for non-perishable items, extended unsold periods can lead to substantial carrying costs, thus affecting profitability.
In situations where the sell-through rate is found to be low, it triggers the need for re-evaluation and adjustment of strategies.
How to Increase Sell Through Rate
Having a high sell-through rate (STR) is indicative of a company’s efficiency of selling its inventory shortly after receiving/manufacturing it. Achieving this without having to discount the merchandise is key to maintaining high profits.
Conversely, a low sell-through rate suggests that products are not being sold quickly. This scenario leads to funds being tied up in warehousing, and increases the risk of inventory becoming either shrinkage or dead stock, which may necessitate discounts, and that can be detrimental to profit margins.
Strategies to Boost Sell-Through Rate:
Reduce average inventory levels. It’s possible that demand planning and forecasting are not accurate, leading to overestimation of demand. Companies should adjust their orders accordingly. Moreover, the apparent savings from bulk shipping discounts might not be beneficial in the long run. It’s vital to manage inventory based on current data.
Implement discounts on finished goods inventory. This approach allows companies to influence demand for their products by making them more attractive price-wise. This strategy may result in increased sales, even though it might result in lower profit margins compared to selling products at the maximum markup. Nonetheless, it is a preferable option to having unsold, obsolete stock.
Improving a low STR essentially involves adjustments in supply or demand, a straightforward strategy when dissected.
Sell Through vs. Inventory Turnover
Sell-through refers to the volume of inventory that is transferred from ownership over a specified period. The Inventory turnover ratio represents how quickly inventory is sold or used within a certain timeframe.
The inventory turnover rate is commonly applied to annual figures and broad, end-period financial assessments. Although both concepts are related to cycle inventory, the primary distinction lies in the “specified period of time.” Sell-through rate offers a more direct calculation method that does not necessitate the inclusion of cost of goods sold (COGS), making it more suitable for shorter intervals.
Sell On Through to the Other Side
Sell through is considered crucial for both vendors and retailers. It serves as a significant inventory KPI essential for maintaining profitability. Regardless of the position within the food supply chain, the sell-through rate is indicative of the compatibility between purchasing and sales strategies.
Aiming for a high sell-through rate is advisable, as products that remain unsold represent a financial liability, immobilizing cash. It’s beneficial to calculate the sell-through rates for various products or categories and pair this data with seasonal demand forecasts to enhance inventory management techniques.
Moreover, leveraging an online marketplace designed to facilitate wholesale ordering and fulfillment can simplify the process of improving the sell-through rate.
Frequently Asked Questions About Sell Through Rate
The STR plays a crucial role in organizing inventory and managing demand effectively. Here are some frequently asked questions with their answers to help understand this concept better:
How Do You Calculate Sell Through Rate In Excel?
**The Sell-Through Rate (STR) is determined by the following formula in Excel: ** The number of units sold divided by the inventory at the beginning of the month (i.e., units on hand) multiplied by 100 equals the STR.
For instance:
The STR calculation results in 1,764 units sold divided by 2,178 units on hand, multiplied by 100, yielding an STR of 80.99%.
What Is Sell-In and Sell-Out?
Sell-in refers to transactions from manufacturers to wholesalers or distributors, while sell-out involves sales from retailers or businesses directly to consumers. This terminology is essential for understanding the movement of materials and products into and out of the market.
The act of sell-in encompasses the delivery of raw material inventory or supplies to entities that either manufacture products or serve as distributors. Conversely, sell-out represents the activities of B2C (see B2C meaning) entities and retail outlets engaging in direct sales to consumers, often employing tactics like social media marketing. This marks the consummation of the supply chain process.
What Are the Limitations of Sell Thru Formula?
Key Considerations When Utilizing STR as a Performance Indicator:
- STR primarily gauges sales at the individual product level. It overlooks crucial elements like profit margins, customer contentment, or the comprehensive profitability of a business.
- Variations in stock levels can impact STR. For instance, should a business acquire more inventory than it sells, its STR might decline, regardless of its ability to sell the merchandise effectively.
- STR may not accurately represent genuine consumer demand. In situations where merchandise is significantly discounted or included in a promotion, such as “buy one get one free,” STR figures could be unnaturally high.
- Comparing STR across various time frames can lead to confusion. For example, during festive seasons when purchases are often gifts for others, STR figures are expected to rise, which could mislead when compared to other periods.
What Is a Sell Rate?
Sell rate is synonymous with sell-through rate. Typically, the term sell-through rate is employed in business writings and articles, yet the term sell rate is also widely used. It is determined using the identical sell-through formula.


